Wheat Is Holding 23.6%, Hogs Hit 61.8% Target
The charts are key to this analysis!
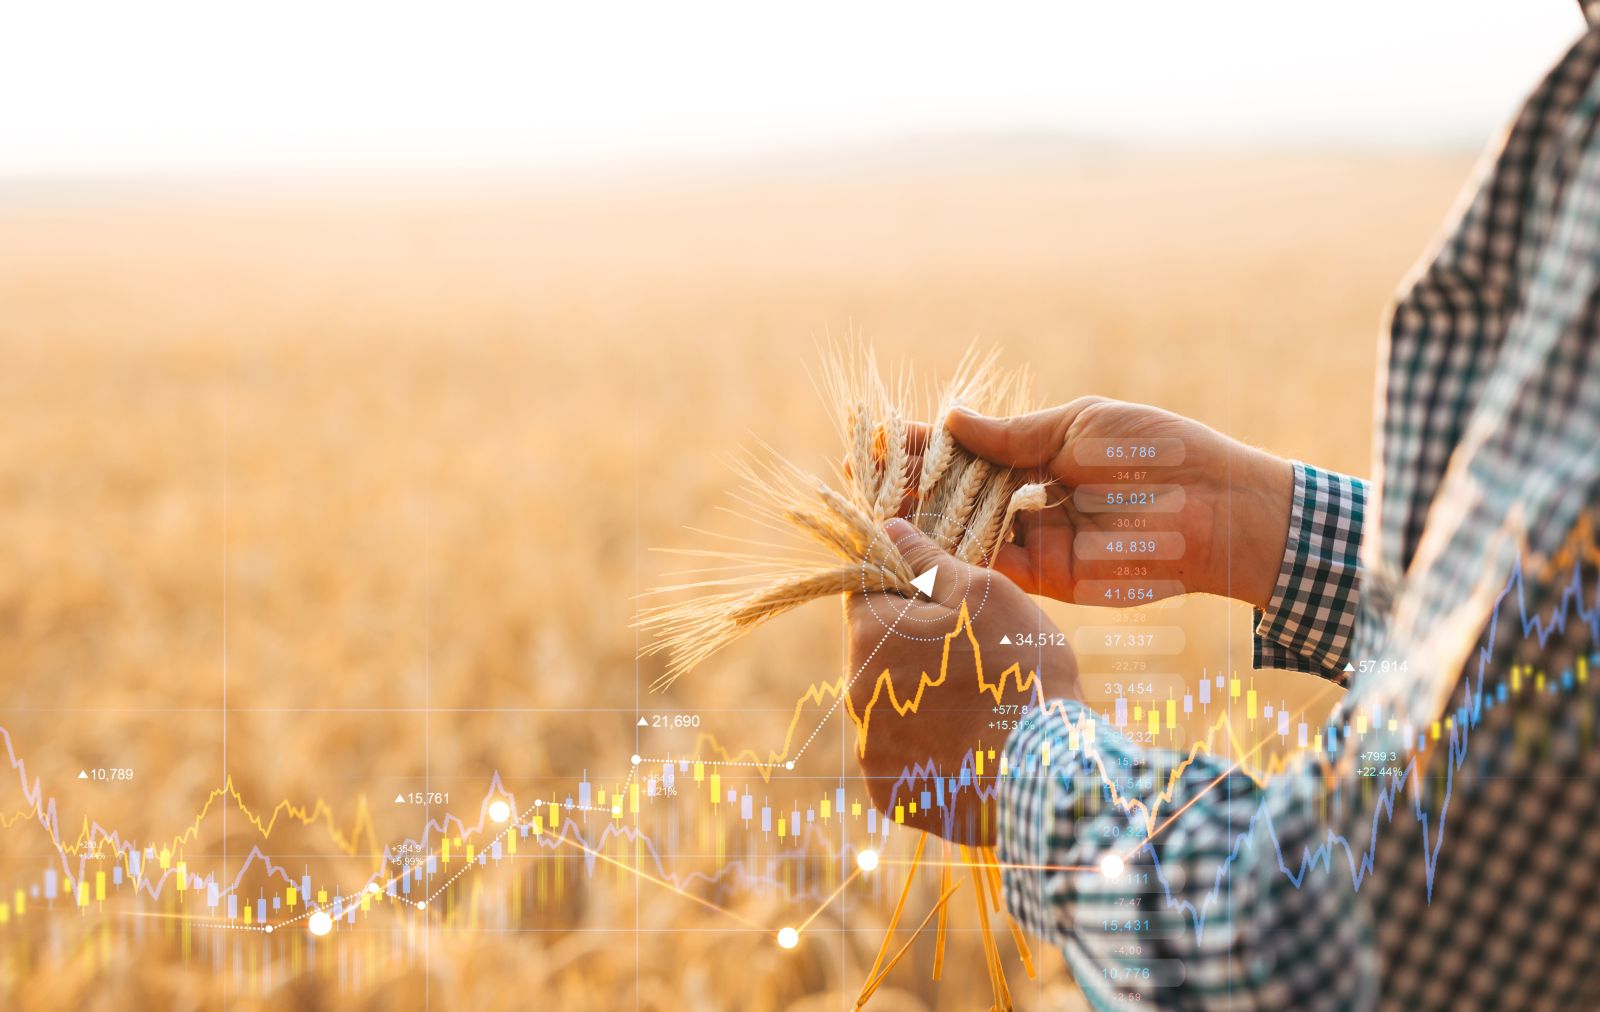
Wheat
(ZWN24)
July
The first sign of a turn higher in Wheat based on the Fibonacci ONE44 rules and guidelines was when the market failed to make a new low on 4/18/24 at a 78.6% retracement, we know following the 78.6% rule that a lot of Bull markets start and end at 78.6% levels.
The rally from it went 80 cents and the setback from there held 38.2% on 5/1/24 at 596.00. With the ONE44 38.2% rule we know a market needs to hold 38.2% to keep the trend intact and that new highs should follow. The rally from it took it to new highs and a total of 90 cents.
Now the market setback could only get 23.6% back and when this happens the market is extremely strong and a run away move can happen. It did have one close below 23.6% at 659.00, but always needs two to confirm a violation of the level.
Use 659.00 as the swing point.
Our short term target above it is 725.00 (38.2%).
Below it, look for 38.2% at 636.00.
We just did our 40th video on how to use the Fibonacci retracements with the ONE44 rules and guidelines.

Lean Hogs
(HEM24)
June
You only have to look at the chart below to see how well the market adheres to the Fibonacci retracements.
The low on 1/3/24 was started by a 23.6% retracement on the continuation chart and the top hit 61.8%on the same chart on 4/10/24 at 107.70, it also hit the 109.10 major Gann square. The long term target based on the ONE44 61.8% rule is, when a market holds 61.8% you can look for a 61.8% move the other way and this was finally completed today ( ok 15 cents short after a $12.00 move). On the chart you can see the 78.6% retracement ended the Bull move on 4/23/24 at 107.80 (the reverse of what started the rally in Wheat).
We will follow the same 61.8% rule and look for 61.8% back up at 104.50. A failure to turn higher from 95.95 should send it down to 78.6% at 92.25.

ONE44 Analytics where the analysis is concise and to the point
Our goal is to not only give you actionable information, but to help you understand why we think this is happening based on pure price analysis with Fibonacci retracements, that we believe are the underlying structure of all markets and Gann squares.
If you like this type of analysis and trade the Grain/Livestock futures you can become a Premium Member.
You can also follow us on YouTube for more examples of how to use the Fibonacci retracements with the ONE44 rules and guidelines.
Sign up for our Free newsletter here.
FULL RISK DISCLOSURE: Futures trading contains substantial risk and is not for every investor. An investor could potentially lose all or more than the initial investment. Commission Rule 4.41(b)(1)(I) hypothetical or simulated performance results have certain inherent limitations. Unlike an actual performance record, simulated results do not represent actual trading. Also, since the trades have not actually been executed, the results may have under- or over-compensated for the impact, if any, of certain market factors, such as lack of liquidity. Simulated trading programs in general are also subject to the fact that they are designed with the benefit of hindsight. No representation is being made that any account will or is likely to achieve profits or losses similar to those shown. Past performance is not necessarily indicative of future results.
On the date of publication, Nick Ehrenberg did not have (either directly or indirectly) positions in any of the securities mentioned in this article. All information and data in this article is solely for informational purposes. For more information please view the Barchart Disclosure Policy here.