
Chart of the Day - December Corn
The information and opinions expressed below are based on my analysis of price behavior and chart activity
Tuesday, September 2, 2025
If you like this article and would like to receive more information on the commodity markets from Walsh Trading, please use the link to join our email list -Click here
Every morning, at about 8 AM CST, I post a short video highlighting where I see opportunities in the futures markets. You can view my most recent video here
December Corn (Daily)
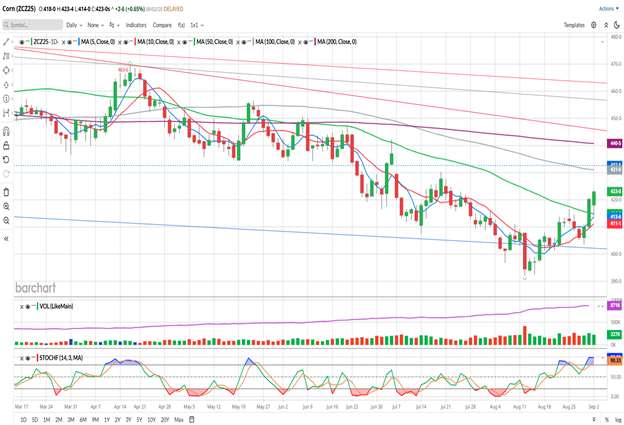
December Corn closed at 4.23 on Tuesday, gaining 2 ¾ cents as we started the holiday-shortened trading week. When I last wrote about Corn in this space on August 21st, my article was certainly leaning toward the bullish side. Since that day, prices did settle back some, getting as low as 4.03 ½ on Thursday of last week, but the 4.00 mark was not breached and prices have rallied almost 20 cents off that low. The market closed above the 50-day average on Friday for the first time since June 6th. At that time, it only lasted 1 day above the 50-day and failed to hold the gains. Today they tested that level at 4.14 ¾, and it held as support. The most recent time that average was touched was on July 3rd, and it failed from that average, gapping lower the next trading day. That price gap, 4.32 ¾, is denoted by the blue horizontal line on the chart, seems to be a likely upside target. Both the 5- and 10-day moving averages are well below the market, offering potential support levels near 4.13 ¾ and 4.11 1/8, respectively. Stochastics (lowest sub-graph) have ticked up into overbought status, a rare occurrence when you look back over the life of this chart. Stochastic readings, currently, are at the highest level over the life, or this view, of the chart.
I would still advocate for long futures positions in December Corn. Look for support near Friday’s high of 4.20 ½, with a risk just below today’s low of 4.14 ¾. That works out to a risk of 5 ½ cents, or $275 before your commissions/fees. Upside targets might be found near the gap (4.32 ¾) which corresponds nicely with the grey 100-day moving average near 4.31. I think that the 200-day average (purple, 4.40 5/8) is a better target, although it may not get there without a few bumps along the road. That first target would result in a potential gain of 12 ¼ cents, or $612.50 before your commissions/fees, with the second resulting in a potential gain of 20 cents (4.20 ½ to 4.40 ½) or $1,000 before your commissions/fees. I’ll leave the upside target to you!
Now, please understand…I’m not BULLISH, bullish. If that makes sense. I do think that we’re going to have a HUGE Corn crop, which is not usually a bullish trend changing event. I also think that the USDA’s 16.7 billion bushel crop estimate is way too large and the market was pricing in extremely high yield numbers. I don’t see anything, at this time, that would project a move much above $4.50. Unless the supply/demand equation changes from an outside influence, which is unknown/unseen at this time, I think that Corn prices will remain in the $4.00-$4.50 range. I think it might take something dramatic to get a sustained rally above $4.60. We’re going to have a lot of Corn on hand and in the bin very shortly. If we do get confirmation of higher yields as harvest progresses, that could be a catalyst for sub $4.00 futures, but in my opinion, the worst Is behind us.
If you like what you’ve read here and would like to see more like this from Walsh Trading, please Click here and sign up for our daily futures market email.
Every morning, at about 8 AM CST, I post a short video highlighting where I see opportunities in the futures markets. You can view my most recent video here
December Corn (Weekly)
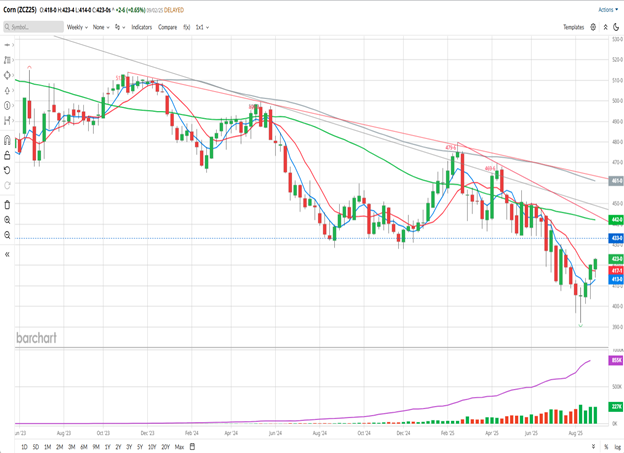
Since posting a “doji” on the weekly chart 4 bars (weeks) ago, Corn prices have steadily moved higher. The close above both the 5- and 10-week moving averages (blue,red at 4.13, 4.17 1/8, respectively) is supportive, I think. We’ve only had 1 day this week, but the 10-week average held as support today and the market closed at it’s highest since the middle of July. Resistance may appear near the lows from 2024 (Aug and Dec) near 4.28-4.30. Beyond that, there isn’t anything too significant until we get to the 50-week average (green, 4.42) as far as technical resistance on the weekly chart.
If you’re interested, you can find Barchart’s Seasonal data for December Corn here.
December Corn (Monthly)
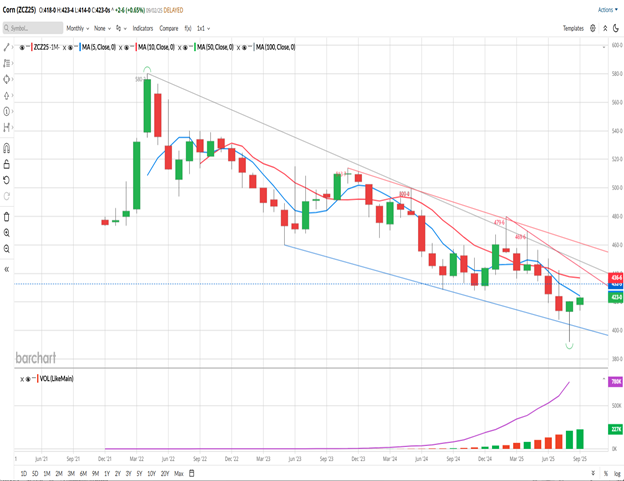
For the month of August, December Corn finished up 6 ½ cents, settling at 4.20 ¼. That was 28 ¼ cents off of the low and just ¼ cent (1 tick) from the high of the month. To my eye, that seems very supportive. Technically speaking, August posted a “Key Market Reversal” bar on the monthly chart. While perhaps not enough of a turn to get wildly bullish, I do think that a move toward 4.50, and perhaps 4.60, is coming. Overall, the monthly trend is still down, but holding above the blue trendline support, drawn off the May ’23 and Aug ’24 lows, can give the bulls some technical strength. The 5-and 10-month averages may offer resistance near 4.24 and 4.37 (blue/red) There are a few trendlines up above the market price, 4.45(red, across Feb and Apr ’24 highs) is the nearest, followed by 4.50 (grey Apr ’22 contract high to May ’24 high) The 3rd one (red, drawn off of the Nov ’23 to May ’24 highs) would be up near 4.60. That should cap the rally, I think, unless the supply/demand equation changes. Bottom line is that I think there is an additional 25 cents or so in upside, currently, in Dec Corn.
If you like what you’ve read here and would like to see more like this from Walsh Trading, please Click here and sign up for our daily futures market email.
Every morning, at about 8 AM CST, I post a short video highlighting where I see opportunities in the futures markets. You can view my most recent video here
Jefferson Fosse Walsh Trading
Direct 312 957 8248 Toll Free 800 556 9411
jfosse@walshtrading.com www.walshtrading.com
Walsh Trading, Inc. is registered as a Guaranteed Introducing Broker with the Commodity Futures Trading Commission and an NFA Member.
Futures and options trading involves substantial risk and is not suitable for all investors. Therefore, individuals should carefully consider their financial condition in deciding whether to trade. Option traders should be aware that the exercise of a long option will result in a futures position. The valuation of futures and options may fluctuate, and as a result, clients may lose more than their original investment. The information contained on this site is the opinion of the writer or was obtained from sources cited within the commentary. The impact on market prices due to seasonal or market cycles and current news events may already be reflected in market prices. PAST PERFORMANCE IS NOT NECESSARILY INDICATIVE OF FUTURE RESULTS. All information, communications, publications, and reports, including this specific material, used and distributed by Walsh Trading, Inc. (“WTI”) shall be construed as a solicitation for entering into a derivatives transaction. WTI does not distribute research reports, employ research analysts, or maintain a research department as defined in CFTC Regulation 1.71.